Measure Twice, Advertise Once: Tracking & Analyzing Your TikTok App Ads for Success
When it comes to achieving TikTok ad success for your app, data reigns supreme. Armed with the right data, you can make informed, data-driven decisions. This invaluable resource allows you to pinpoint where your app ads excel and where they may fall short. By harnessing data, you can fine-tune your app marketing strategies, thereby maximizing your resources.
However, you might wonder, how do you track your TikTok ad data to improve the visibility of your app? More importantly, how do you analyze and interpret this data? Fear not, as that’s precisely what you’ll discover in this post!
How TikTok Ads Help Your App
TikTok ads offer a powerful platform to promote your app and reach a vast audience of engaged users. Here’s how TikTok ads can help promote your app:
- Targeted Advertising: TikTok provides advanced targeting options based on demographics, interests, behaviors, and more. This allows you to tailor your ads to reach specific segments of TikTok’s diverse user base who are most likely to be interested in your app.
- Brand Awareness: TikTok ads can help increase awareness of your app among a broad audience. By leveraging TikTok’s viral nature and user-generated content, you can create engaging ads that resonate with users and encourage them to learn more about your app.
- Drive App Installs: TikTok offers app install ads that allow users to download your app directly from the platform. With compelling ad creatives and clear calls-to-action, you can drive users to install your app and increase your user base.
Overall, TikTok ads offer a dynamic and effective platform to promote your app, connect with your target audience, and drive app installs and engagement. By leveraging TikTok’s innovative ad formats, targeting options, and analytics, you can effectively promote your app and achieve your marketing goals.
Setting Up for Success: Essential Metrics to Track for Your TikTok App Ads
TikTok ad metrics are essential numbers that gauge the performance of your ads on the platform. When you analyze TikTok advertising data, it is crucial for app developers, owners, and advertisers to track performance, optimize campaigns, and reduce marketing costs. Metrics help evaluate ad effectiveness, adjust content based on audience interest, and determine ROI for better budget management.
TikTok tracks various ad metrics, yet some hold more significance than others. Here are the most crucial ones:
- Total Cost: The total amount spent on running the ad campaign.
- Impressions: The number of times the ad is displayed to users.
- Clicks: The number of times users click on the ad.
- Conversions: The number of desired actions taken by users after clicking on the ad, such as app installs, purchases, or sign-ups.
- Click Rate: The percentage of impressions that result in clicks, calculated by dividing the number of clicks by the number of impressions and multiplying by 100.
- Conversion Rate: The percentage of clicks that result in conversions, calculated by dividing the number of conversions by the number of clicks and multiplying by 100.
- CPC (Cost Per Click): The average cost paid for each click on the ad, is calculated by dividing the total cost by the number of clicks.
- CPM (Cost Per Mille): The cost of reaching 1,000 users with the ad, is calculated by dividing the total cost by the number of impressions and multiplying by 1,000.
- Conversion Cost: The average cost paid for each conversion, is calculated by dividing the total cost by the number of conversions.
These dimensions provide valuable insights into the performance and efficiency of TikTok ad campaigns, helping app advertisers assess their effectiveness and make informed decisions for optimization.
How to View TikTok App Ads Metrics
To access the metrics of your ads, you’ll need to navigate to the TikTok Ads Manager. This platform serves as the primary database housing all the metrics tracked by TikTok.
Once you’re on the TikTok Ads Manager, there are two types of results:
Dashboard page:
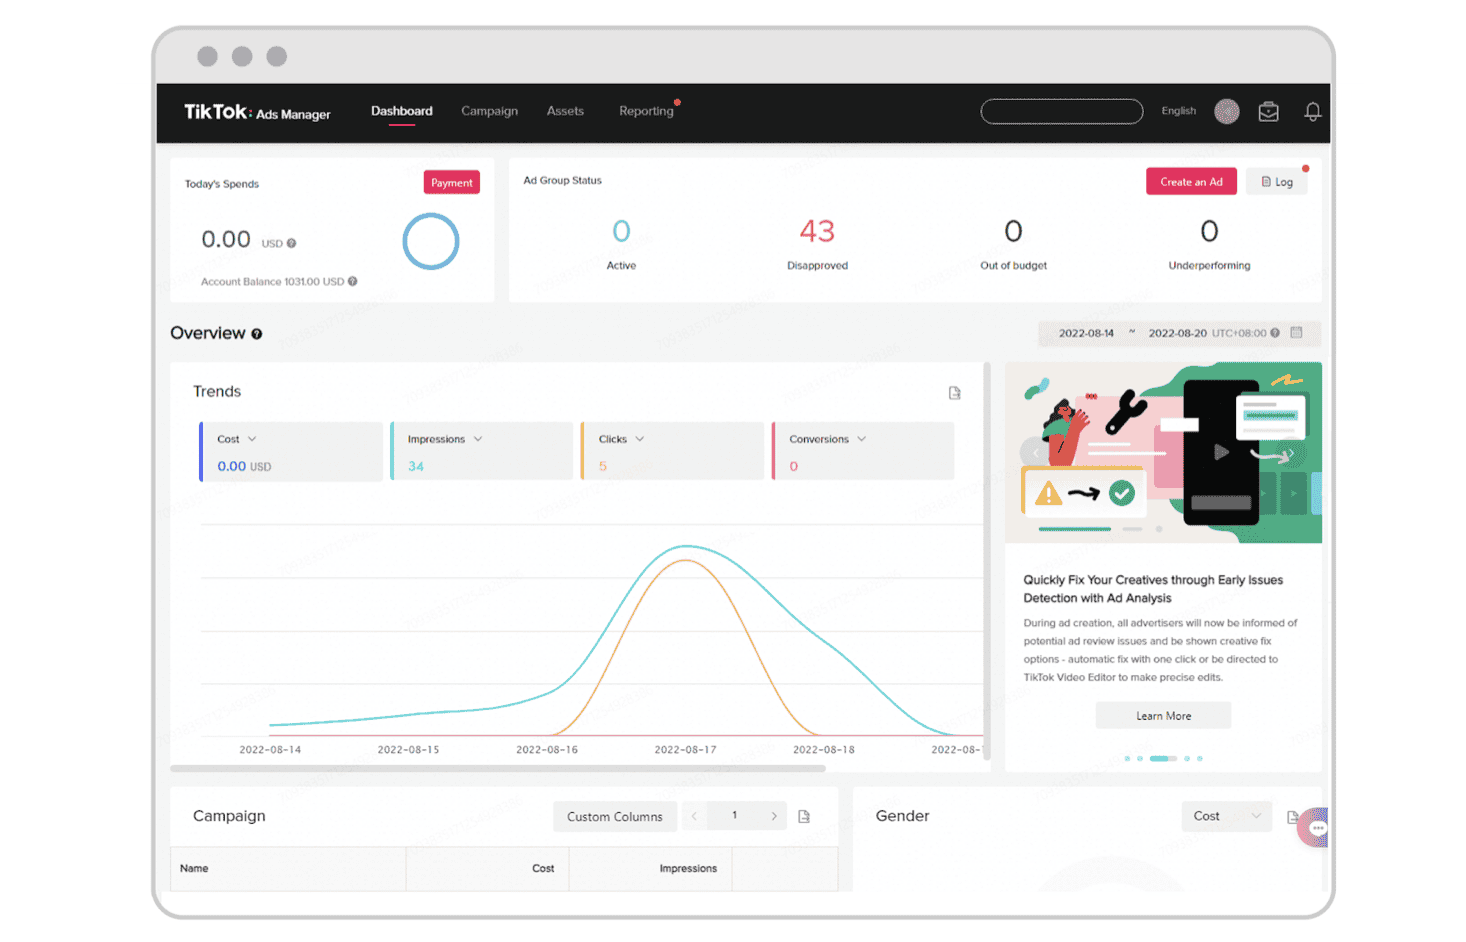
The Dashboard page offers a high-level overview, allowing you to quickly gauge your performance across campaigns, ad groups, and ads. Here, you’ll find up-to-date metrics, ad spend, and the status of all your campaigns.
With this comprehensive view, you can easily assess campaign performance and spot trends or significant changes for further investigation.
Reviewing the data can be overwhelming, but learning from experienced marketers can provide valuable insights. Here are three helpful tips:
- Keep an eye on your account’s operation logs by clicking the ‘Log’ link in the Ad Group Status area.
- Ensure that all campaigns, ad groups, and ads are marked as ‘Active’ to confirm ongoing ad activity.
- Dive deeper into your performance metrics by examining various dimensions such as demographics, operating system, and dayparting.
Campaign page:
If you’ve noticed anything unusual on the Dashboard or need to concentrate on particular campaigns, the Campaign page is your solution. Here, you can explore the intricacies of your individual campaigns, ad groups, and ads. There are various actions you can take on the Campaign page. Here are a few:
- Search and Filter: Navigate to the ‘Campaign’ tab to access a list of all your campaigns. Instead of scrolling through rows, utilize the ‘Search’ bar to quickly find a specific campaign by name or ID. Additionally, employ the ‘Filter’ button to narrow down campaigns based on different criteria.
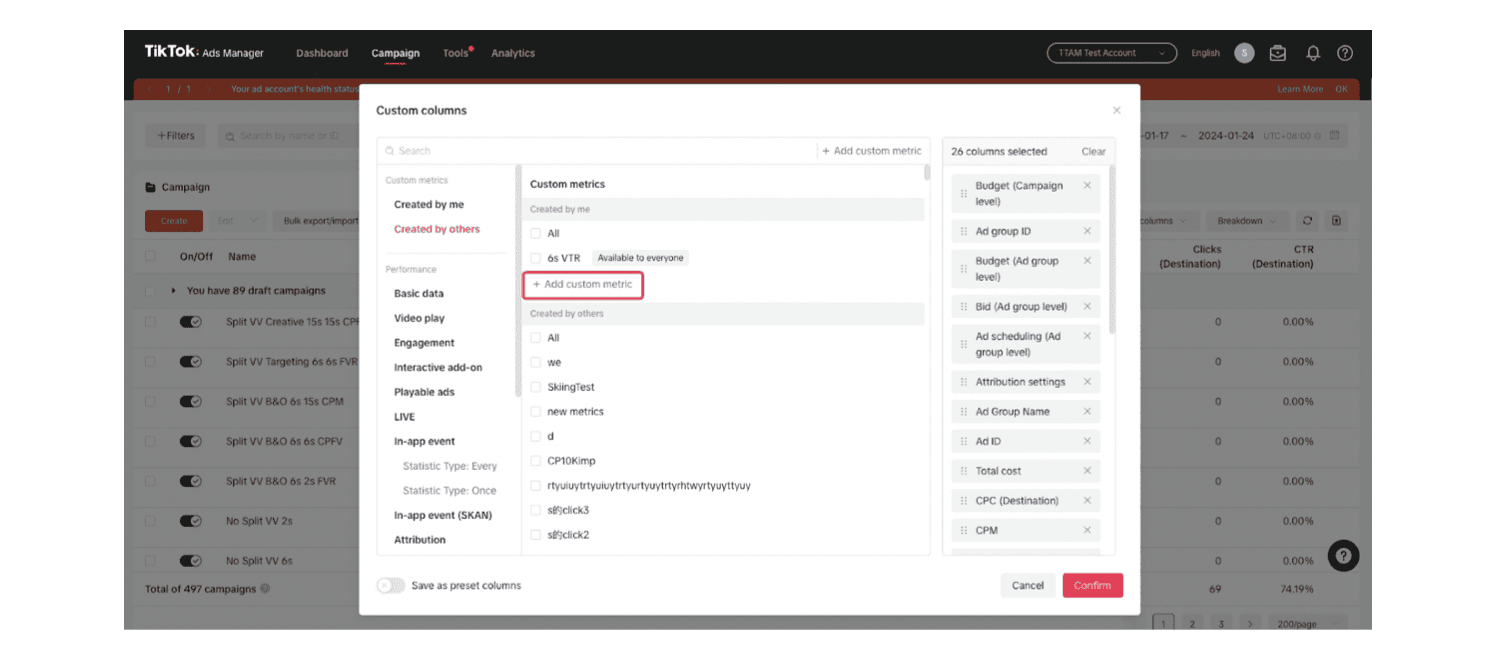
- Customize Columns: While the Campaign view provides a default set of metrics, you can personalize it to suit your needs. Access the ‘Default Columns’ dropdown and select ‘Custom Columns’ to tailor your view according to your business requirements. Remember to save your column preferences for future ease of access.
- View Data for Detailed Insights: For deeper insights into a campaign’s performance, click on ‘View Data’ under each campaign, ad group, or ad. Here, you can analyze performance data and audience breakdowns. Customize the date and time range, adjust chart displays (daily or hourly), and select preferred dimensions for your charts.
- Audience Segmentation: Switch to the ‘Audience’ tab to segment your performance data by various audience dimensions such as age, gender, location, interest, and device.
- Export and Share: Don’t overlook the option to export interesting data or compelling charts for sharing with your team. This facilitates collaborative analysis and storytelling.
Reporting Page:
Aside from Dashboard and Campaign tab, there’s another useful tool that you can explore, which is the Reporting Page. TikTok’s Reporting page empowers you to tailor and streamline the export and delivery of your reports according to your preferences and schedule. Here are some of the things you can do on this page:
- Crafting a Report: Begin by accessing the ‘Reporting’ tab in TikTok Ads Manager. Click ‘Create’ and choose between ‘Custom Report’ for personalized reports or ‘From Template’ for pre-designed options.
- Customizing Reports: With Custom Reports, you have full control over the data you include. Select from a range of Dimensions (such as campaigns, ad groups) and Metrics (like CPM, CPC). Easily organize your data and adjust the order as needed.
- Time Range Selection: Define the timeframe for your data, choosing from preset options like yesterday or the last 30 days, or set a custom range.
- Template Options: Explore pre-defined templates for quick access to common metrics. Tailor templates to your needs by adding, deleting, or modifying Dimensions and Metrics.
- Export and Share: Once your report is configured, export it in xlsx or csv formats with a click of ‘Run & Export’ for convenient reference.
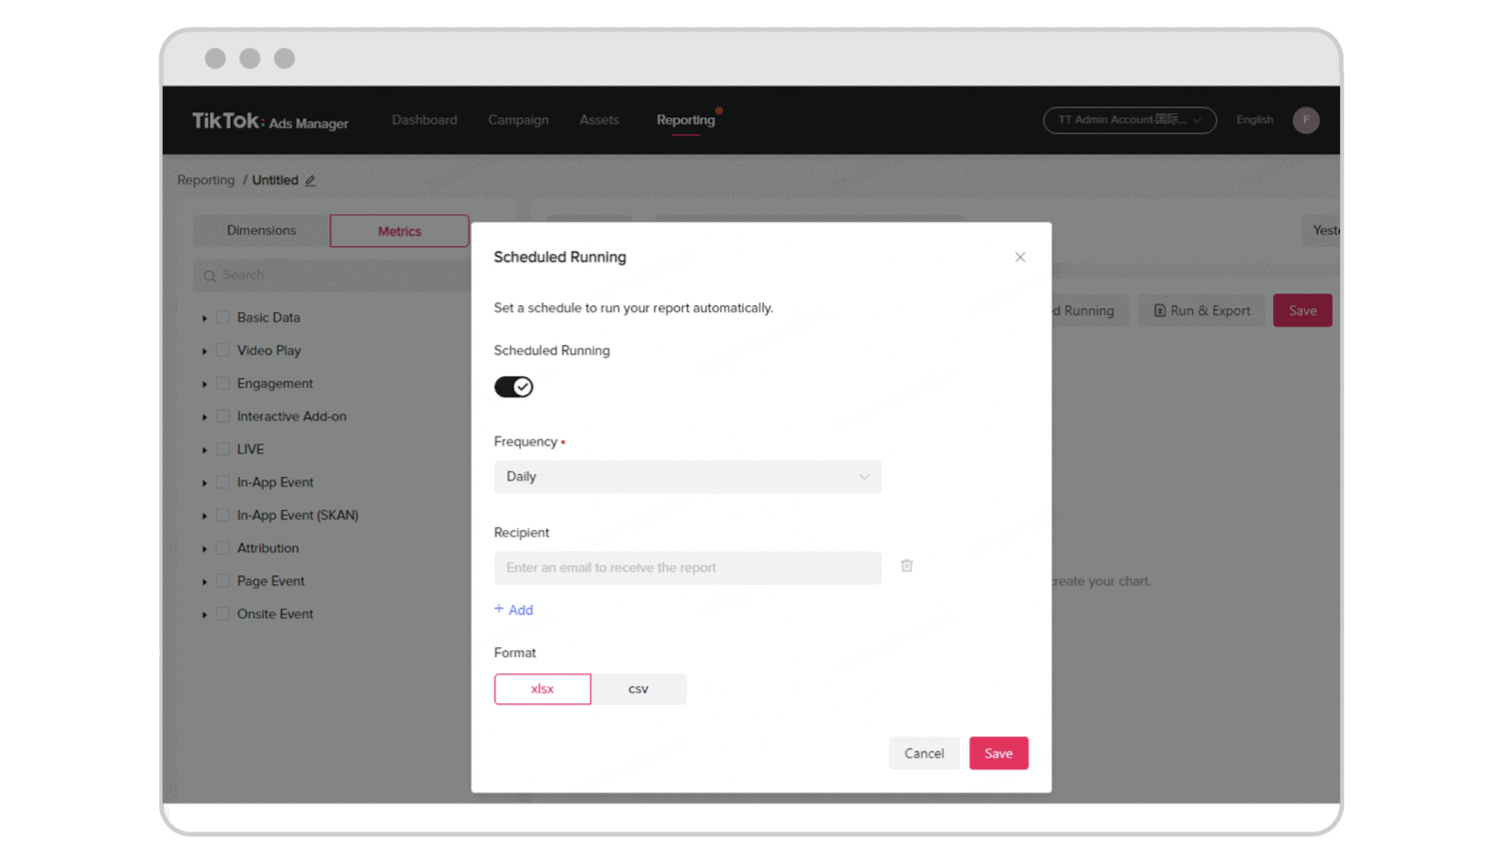
- Scheduling Reports: Optimize efficiency by scheduling reports to be automatically generated and delivered via email. Specify recipients, frequency, and delivery dates, ensuring timely insights for your team or stakeholders.
With TikTok’s Reporting page, effortlessly manage and distribute performance insights, keeping your team informed and empowered.
How to analyze data from TikTok Ads Manager
It’s not enough to simply gather data for your app ads. You need to know how to take these data, analyze them, and identify meaningful ways to improve your data understanding. Analyzing data from TikTok Ads Manager involves several steps to extract actionable insights. Here’s a guide:
- Review Key Metrics: Start by reviewing key performance metrics such as impressions, clicks, conversions, click-through rate (CTR), conversion rate, cost per click (CPC), and return on ad spend (ROAS). These metrics provide a snapshot of your campaign’s overall performance.
- Segmentation: Break down your data by different dimensions such as demographics (age, gender), location, device, or placement. Analyzing data by segments allows you to identify trends and patterns among specific audience groups.
- Attribution Modeling: Understand the customer journey and attribution models to determine how different touchpoints contribute to conversions. Analyze data across various attribution models such as first-click, last-click, or multi-touch attribution to gain a comprehensive understanding of your campaign’s impact.
- Comparative Analysis: Compare the performance of different campaigns, ad groups, or ads to identify top performers and areas for improvement. Look for patterns in high-performing content or targeting strategies that can be replicated in future campaigns.
- Trend Analysis: Identify trends over time by analyzing data on a daily, weekly, or monthly basis. Look for patterns in performance fluctuations and correlate them with external factors such as seasonality or marketing initiatives.
- Optimization Opportunities: Use insights from your data analysis to optimize your campaigns in real time. Make adjustments to targeting, creative elements, or bidding strategies based on data-driven recommendations to improve campaign performance.
- Testing and Iteration: Implement A/B testing and experimentation to continually refine your campaigns. Test different ad formats, messaging, or audience targeting strategies to identify the most effective approaches for achieving your advertising goals.
- Data Visualization: Utilize data visualization tools to present your findings in a clear and visually compelling manner. Charts, graphs, and dashboards can help communicate insights to stakeholders and facilitate data-driven decision-making.
By following these steps, you can effectively analyze data from TikTok Ads Manager and leverage insights to optimize your advertising campaigns for success.
Ensure the Success of Your TikTok App Ads
Now that you’ve learned how to analyze and track TikTok ads, it’s time to put that knowledge into action. Don’t miss the chance to partner with ShyftUp. They offer the tools, expertise, and experience needed to enhance your app’s visibility through TikTok ads. Specializing in maximizing app downloads and cultivating highly engaged and loyal users, ShyftUp is the perfect ally for your app’s success. Give them a try today!


